Visiting Europe’s process industries to improve the reliability of monitoring algorithms.
Industrial monitoring algorithms utilize operation data to maintain productivity and safety in process plants at a high level at all time. While some methods include a physical model of the underlying process, a lot of algorithms (derived from statistics and machine learning) rely solely on the recorded data. Those data-driven methods are easier to set up and often provide a satisfactory performance, but their efficiency can be impacted by external factors that are not well captured in the data. Improving the robustness of data-driven methods is a key factor to extend their applicability.
Assessing the industrial robustness of an algorithm is not an easy task for a PhD student. It requires experience and domain knowledge that are usually not in open access on the internet, and getting exposure to the relevant people or resources may require the student to get out of his or her comfort zone. Partnering with industrial companies is a first step to help PhD students to establish contacts and get access to possible case studies. When it comes to industrial applicability and robustness, it is also valuable to get exposure to various production facilities and various industries. Looking for patterns across facilities and across industries is a great source of inspiration to identify promising research directions.
The European Industrial Doctorate program offers such a framework. As industrial PhD students, we were offered the opportunity to visit facilities and talk to experts from various industries. Recent site visits include chemical facilities (BASF in Ludwigshafen, Ineos in Cologne), a stainless steel plant (Acciai Speciali Terni in Terni), a gas processing plant (Equinor in Kollsnes), and a wood-based panels factory (Sonae Arauco in Valladolid). The discussions with site engineers and operators brought practical ideas that we could directly integrate in our research work.
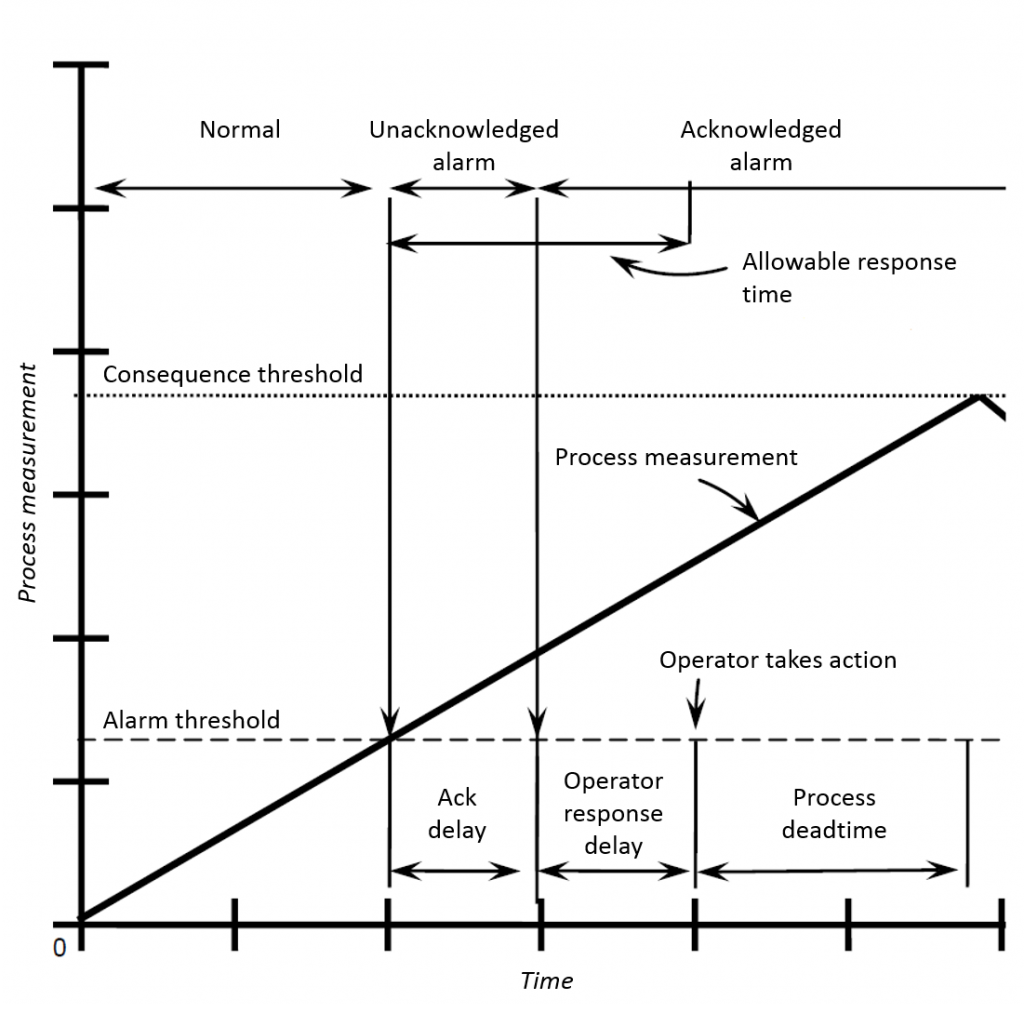
One of those ideas is the integration of information from the safety system of the plant into the data-driven monitoring algorithms. Each complex industrial process is associated with a safety system designed according to the technical specifications of the process. Process alarms are a typical example, and Figure 1 depicts the alarm response timeline used to configure alarms according to the standards [1]. The consequence threshold indicates the limit after which a consequence begins to occur based on safety and technical considerations on the physical assets. The alarm threshold is derived from the consequence threshold taking into account the process deadtime, the operator response delay and the acknowledgement delay for the corresponding process measurement. In this case, information about the safe range of variation of the variables is immediately available in the safety system and can be used to improve the accuracy of data-driven fault detection and diagnosis algorithms [2].
[1] IEC (International Electrotechnical Commission), Management of Alarms Systems for the Process Industries. IEC 62682. IEC, 2014.
[2] M. Lucke, M. Chioua, C. Grimholt, M. Hollender, and N. F. Thornhill, “On improving fault detection and diagnosis using alarm-range normalisation,” in Proceedings of 10th SAFEPROCESS Symposium, Warsaw, Poland, August 29-31, 2018, 2018.